Visualizing Workflows (or any state machine) with D2

I have never used Workflow before working at Square, and while the programming paradigm requires a slight learning curve for first-time users, the framework does elegantly deliver on the promise of enabling a developer to drive an application with composable state machines. However, this writing is not an evaluation of Workflow as a mobile app development framework—for that, see Why Workflow?—instead, this post focuses on visualizing workflows (or any state machine) with a new diagramming tool I discovered recently, D2.
D2 is a scripting language for turning text into diagrams. The name D2 stands for Declarative Diagramming, and the project aspires to reduce the amount of time required by software teams to create and maintain high-quality diagrams. This thesis resonates with me. I am rolling into my sophomore year working on the Square Register, where a seemingly simple feature may require updates to modules shared by many teams. In a doc-heavy culture—which I appreciate—crafting high-quality diagrams improves the feedback that peers can provide and expands the accessibility of changes to team members that may not be as familiar with a project.
Diagramming, though, presents some unique challenges to developers. For the proficient, constructing a high-quality diagram may feel more complex than just writing code with thoughtful comments. Some developers may feel overwhelmed attempting to visualize a software change on an infinite white canvas. Additionally, traditional diagramming tools like Lucidchart—my current diagramming tool of choice—offer a mostly drag-and-drop experience that usually works well but differs significantly from the comfortable experience a finely tuned IDE provides a seasoned programmer.
Getting Started with D2
To get started diagramming with D2, follow the guide, and quickly, you should be able to render a simple diagramming "hello, world" like the following. Additionally, you can explore the D2 Playground as an alternative to installing the tool locally.
hello -> world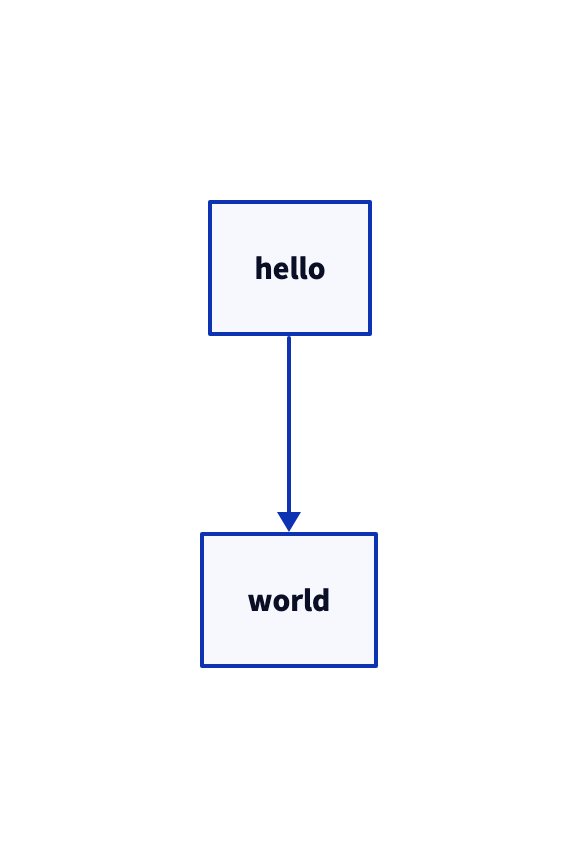
As promised, D2 emits the simple text as a box-and-line relationship between two nodes. Plenty of text-to-diagram tools enable a similar use case, but I think D2 shines in laying out shapes, connections, containers, and text/code. Namely, these primitives work well in visualizing a workflow or a collection of composable state machines.
What is a state machine again?
Put simply in the Workflow glossary, a state machine is
Reviewing this definition, one can apply the D2 primitives accordingly.
- set of states - shapes
- graph - shapes linked via connections
- transitions - shapes connected via edges with labels that explain the event that caused the state change and the action taken as a result
The objective begins to take form here, but let's try with an example I dug up from my Embedded Systems lecture from 2011—yes, I paid good money for those lectures, so I kept them 😄. The lecture defines a Mealy machine as a state machine whose outputs depend on the current state and the inputs. Additionally, the lecture lays out a simple example:
- States: standing, sitting, and sleeping
- Inputs: ok, tired, curious, and anxious
- Outputs: nothing, stand up, sit down, sit up, and lie down.
Starting simple, the states can be shown with the following D2 script.
standing
sitting
sleeping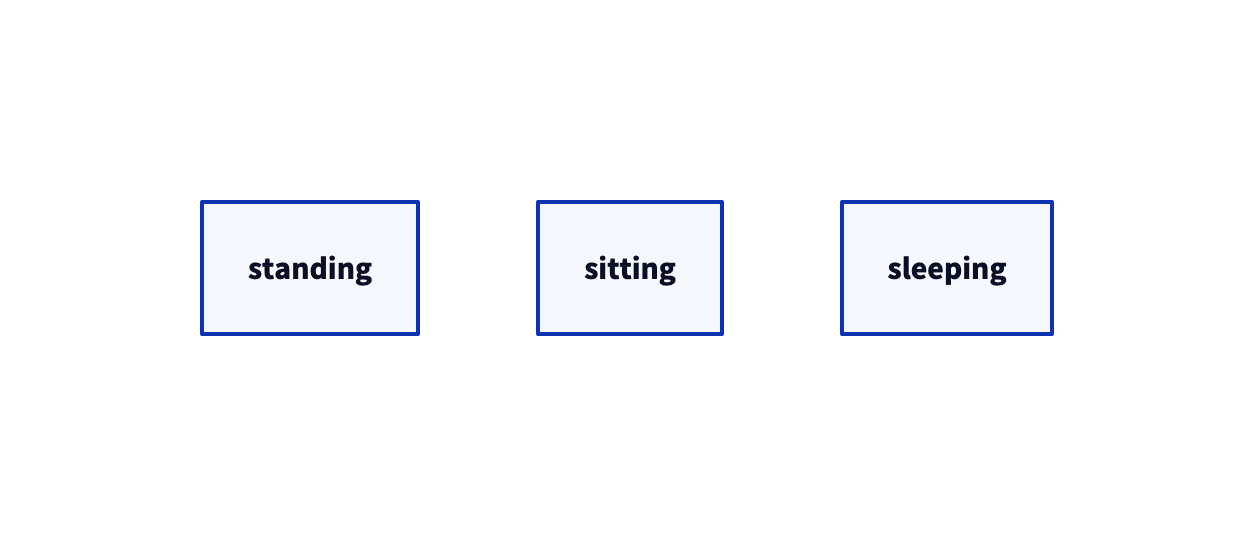
Now, apply the inputs to each state to understand what events cause the state transitions.
standing -> standing: ok, curious, anxious
standing -> sitting: tired
sitting -> sitting: curious, ok
sitting -> standing: anxious
sitting -> sleeping: tired
sleeping -> sleeping: tired, ok
sleeping -> sitting: curious
sleeping -> sitting: anxious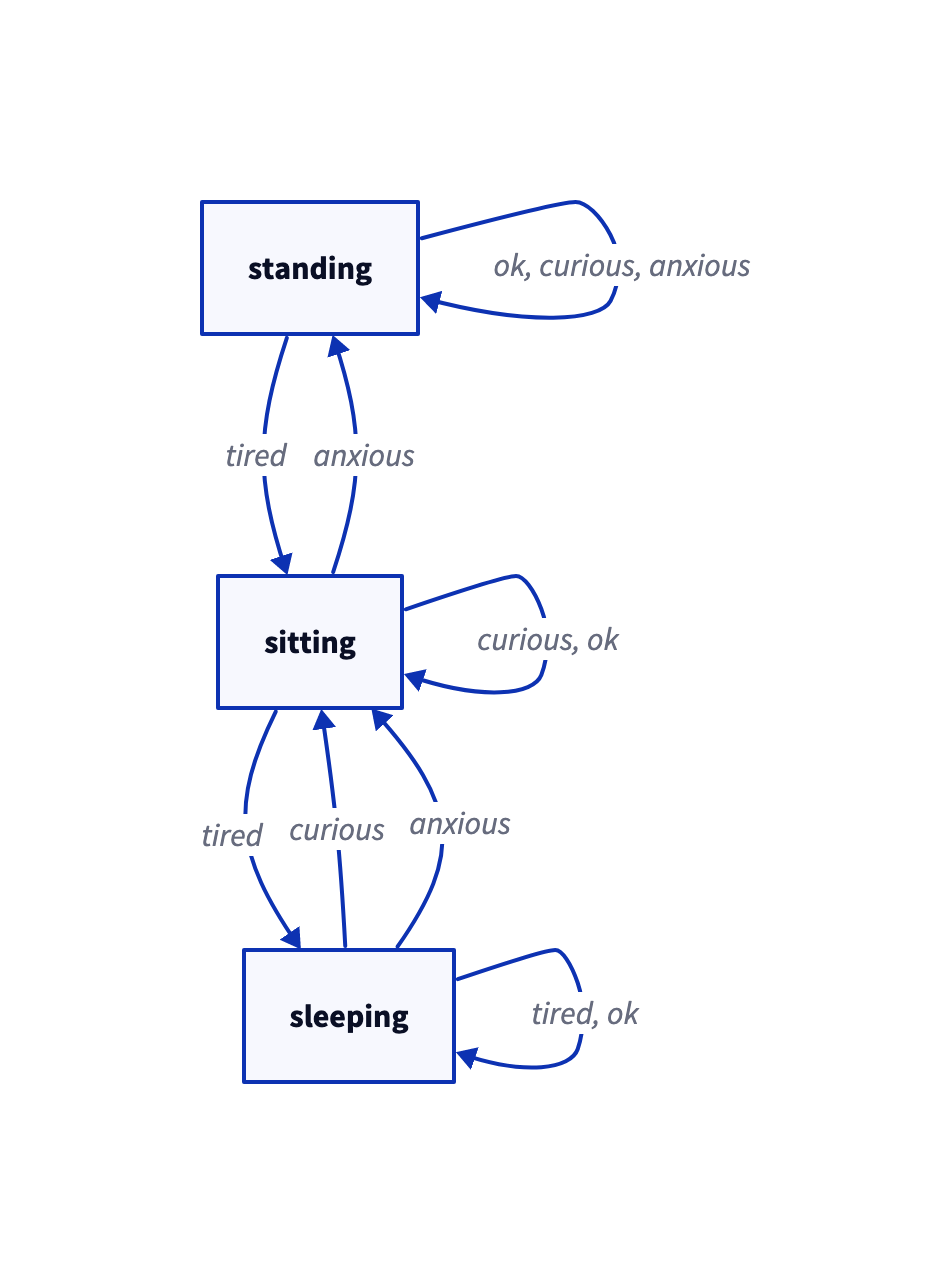
This state machine seems reasonable but omits the action taken as a result of the inputs. Appending the actions to the events provides a clearer picture of the state machine.
standing -> standing: ok, curious, anxious/do nothing
standing -> sitting: tired/sit down
sitting -> sitting: curious, ok/do nothing
sitting -> standing: anxious/stand up
sitting -> sleeping: tired/lie down
sleeping -> sleeping: tired, ok/do nothing
sleeping -> sitting: curious, anxious/sit up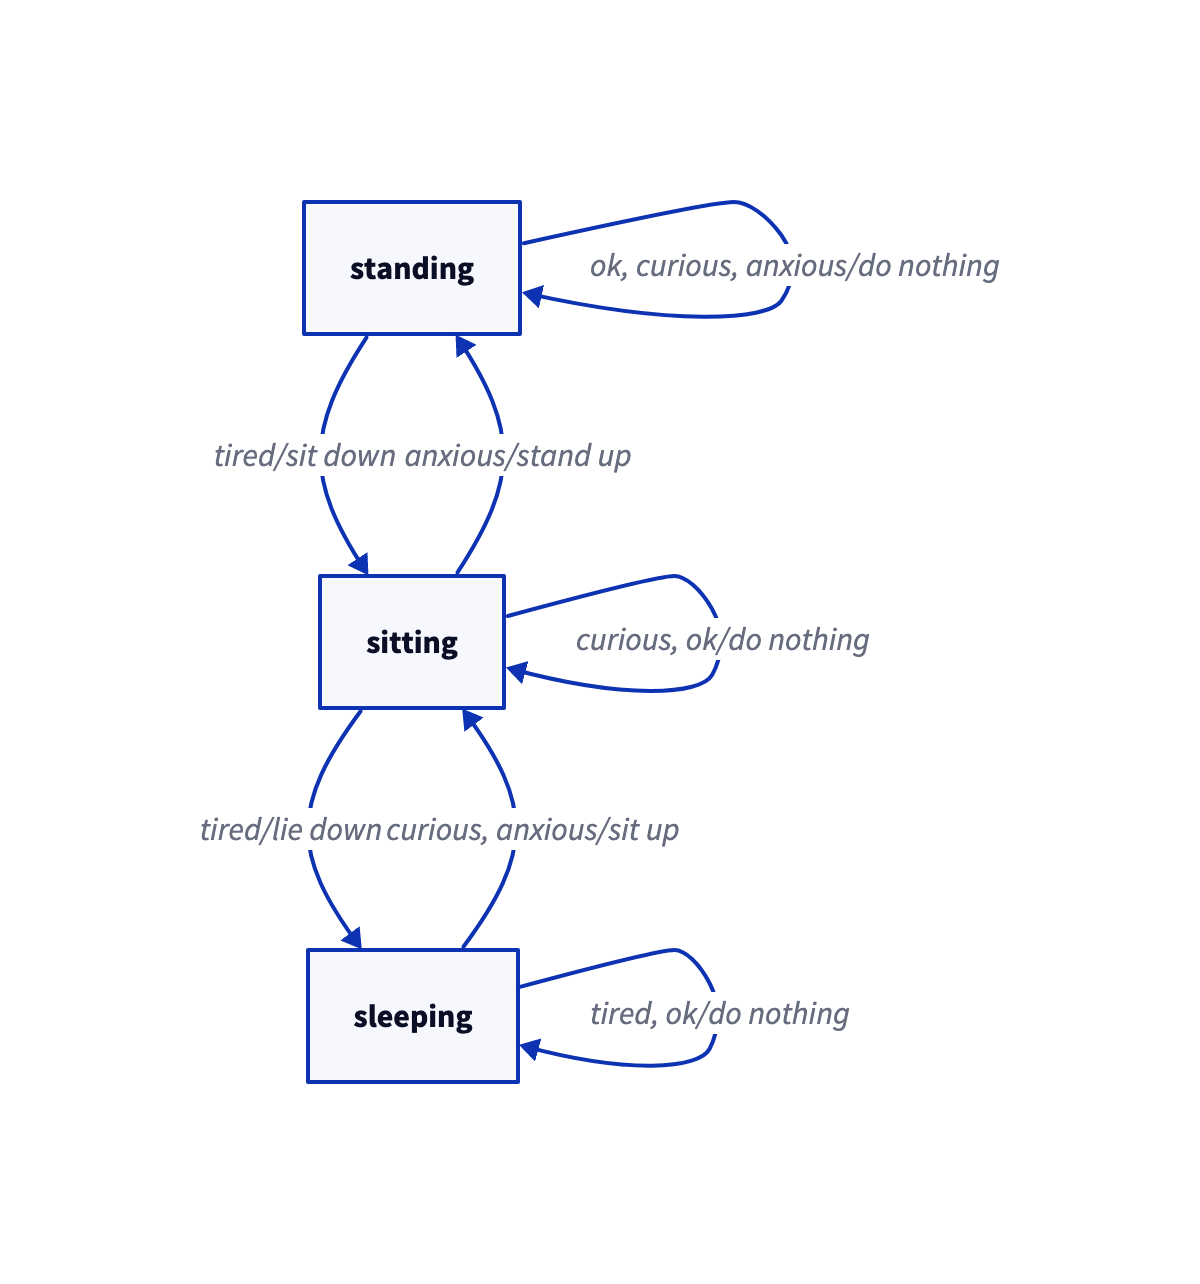
Diagramming a Workflow
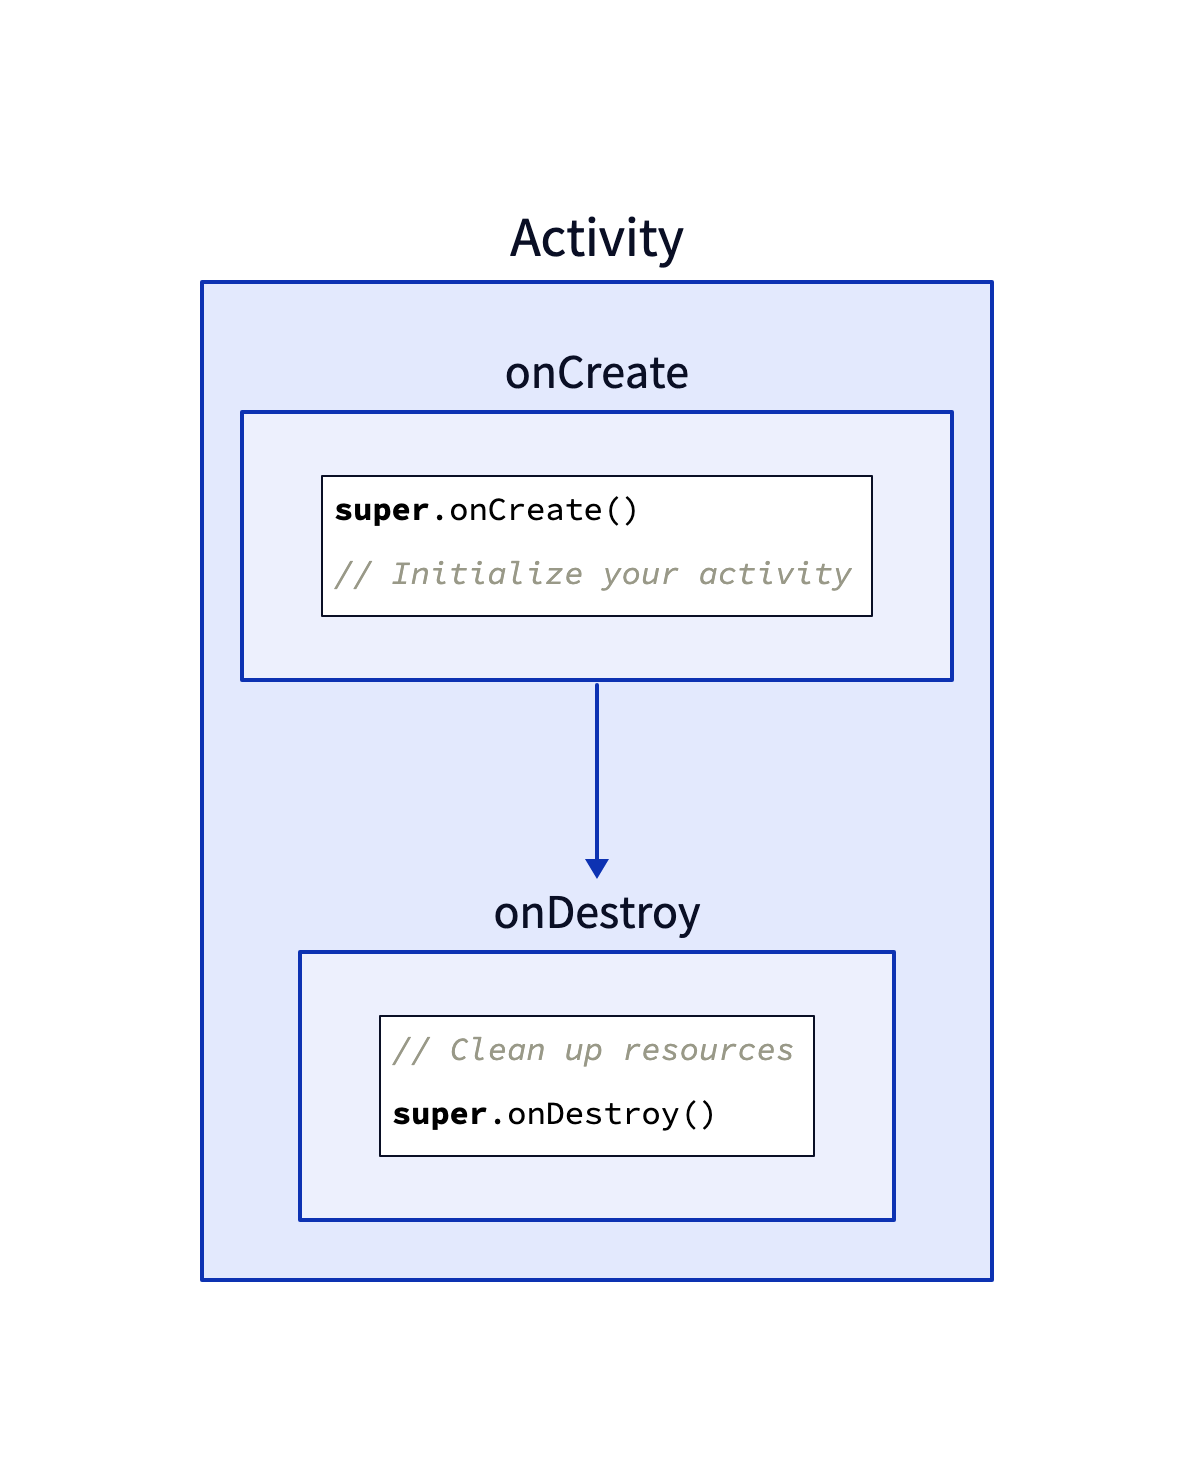
The previous example demonstrates how to apply D2 to a simple state machine with a few states, but diagramming a Workflow driven app adds some complexity. Referring back to the project definition, a Workflow can be composed of other Workflows, so unlike the previous example, one must visualize multiple state machines where the output of one may change the state of another. To help visualize this complexity, one can insulate each Workflow within a D2 container, as shown in the following familiar example.
# D2 supports declaring a container and a label
activity: Activity {

  # You can also declare a container within a container
  onCreate: {

    # One unique feature about D2 is the ability to write
    # code snippets within a container as well
    snippet: |kotlin
      super.onCreate()

      // Initialize your activity
    |
  }

  onDestroy: {
    snippet: |kotlin
      // Clean up resources

      super.onDestroy()
    |
  }

  onCreate -> onDestroy
}
Without further ado, let's actually try to apply these primitives to a real example. The Workflow Kotlin project provides a sample Todo app that provides a prime candidate to diagram; there are a couple of screens and a simple Workflow hierarchy.
The Todo app contains the following Workflows that can be considered unique state machines.
TodoListsAppWorkflowTodoListsWorkflowTodoEditorWorkflow
Following the state-machine as a D2 container convention established previously, the Todo Workflow hierarchy can be shown in the following diagram.
todo: TodoListsAppWorkflow
todo-lists: TodoListsWorkflow
todo-editor: TodoEditorWorkflow

todo -> todo-lists
todo -> todo-editor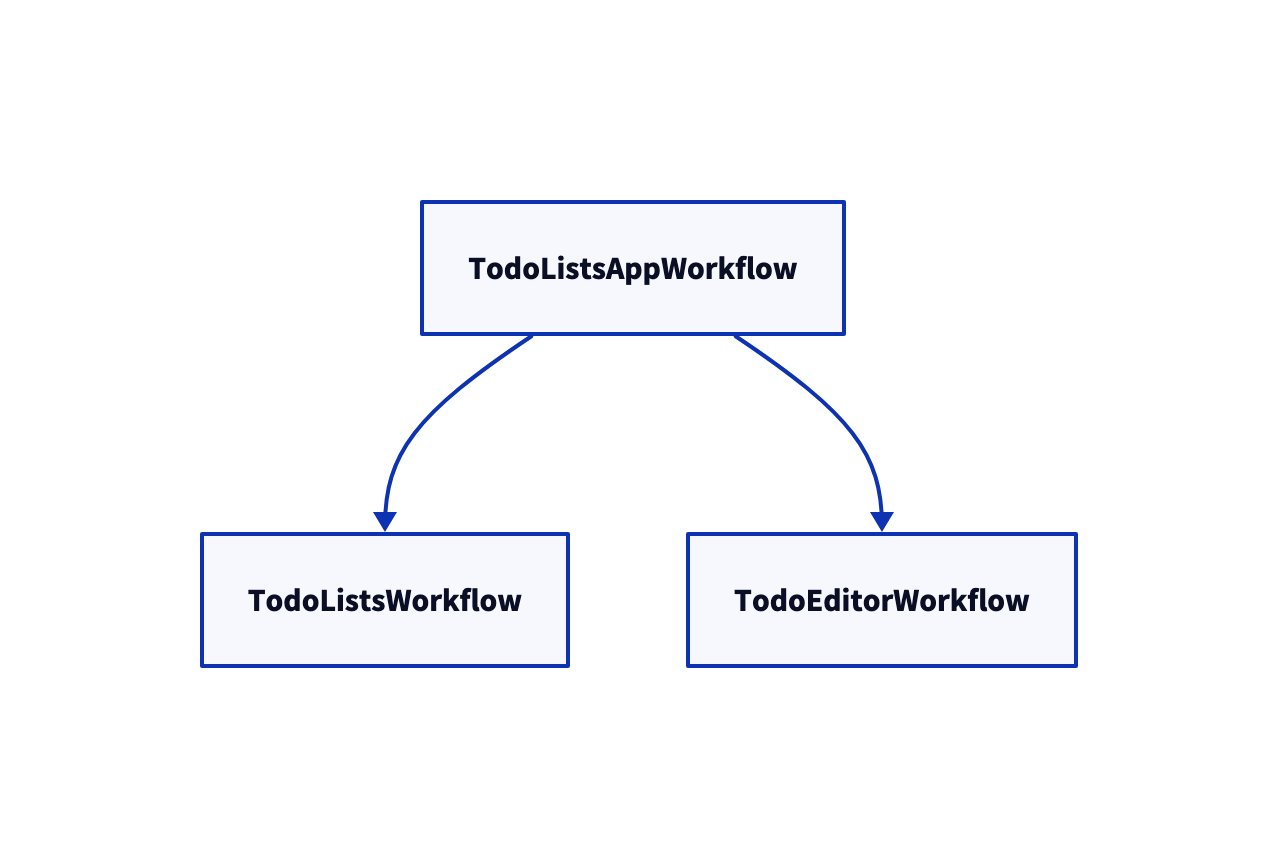
This diagram helps clarify the relationship between the Workflows but lacks clarity with respect to how each state-machine progresses and impacts the state of the others. A review of each Workflow definition reveals the states, events, and outputs associated with each Workflow as follows.
TodoListsAppWorkflow
Workflow authors follow a convention where each state is represented as a Sealed class. Take note of the different properties contained in each state, as this will come up again. Additionally, this workflow emits no output.
sealed class TodoListsAppState {
  abstract val lists: List<TodoList>

  data class ShowingLists(
    override val lists: List<TodoList>
  ) : TodoListsAppState()

  data class EditingList(
    override val lists: List<TodoList>,
    val editingIndex: Int
  ) : TodoListsAppState()
}
TodoListsWorkflow
This Workflow renders a list of Todo lists and is considered stateless. For simplicity, this post will not cover Workflow renderings or working with the Workflow UI infrastructure.
TodoEditorWorkflow
This Workflow provides the state machine for when the user is editing a specific TodoList.
// TodoEditorWorkflow State
data class TodoEditingSession(
  val id: Int,
  val title: TextController,
  val rows: List<RowEditingSession>
) {
  data class RowEditingSession(
    val textController: TextController,
    val checked: Boolean = false,
    val id: Int,
  )
}

sealed class TodoEditorOutput {
  data class ListUpdated(val newList: TodoList) : TodoEditorOutput()
  object Done : TodoEditorOutput()
}
Now the Workflow hierarchy with each State can be visualized as follows.
todo: TodoListsAppWorkflow {
  showing-lists: ShowingLists {
    state: |kotlin
      lists = listOf(
        TodoList("Groceries"),
        TodoList("Daily Chores"),
        TodoList("Reminders")
      )
    |
  }

  editing-lists: EditingList {
    state: |kotlin
      lists = listOf(
        TodoList("Groceries"),
        TodoList("Daily Chores"),
        TodoList("Reminders")
      )
      editingIndex = 0
    |
  }
}
todo-lists: TodoListsWorkflow {
  explanation: |md
    This workflow contains no state and simply renders the current list of Todo lists.
  |
}
todo-editor: TodoEditorWorkflow {
  session: TodoEditingSession {
    state: |kotlin
      id: Int
      title: TextController
      rows: List<RowEditingSession>
    |
  }
}

todo -> todo-lists
todo -> todo-editor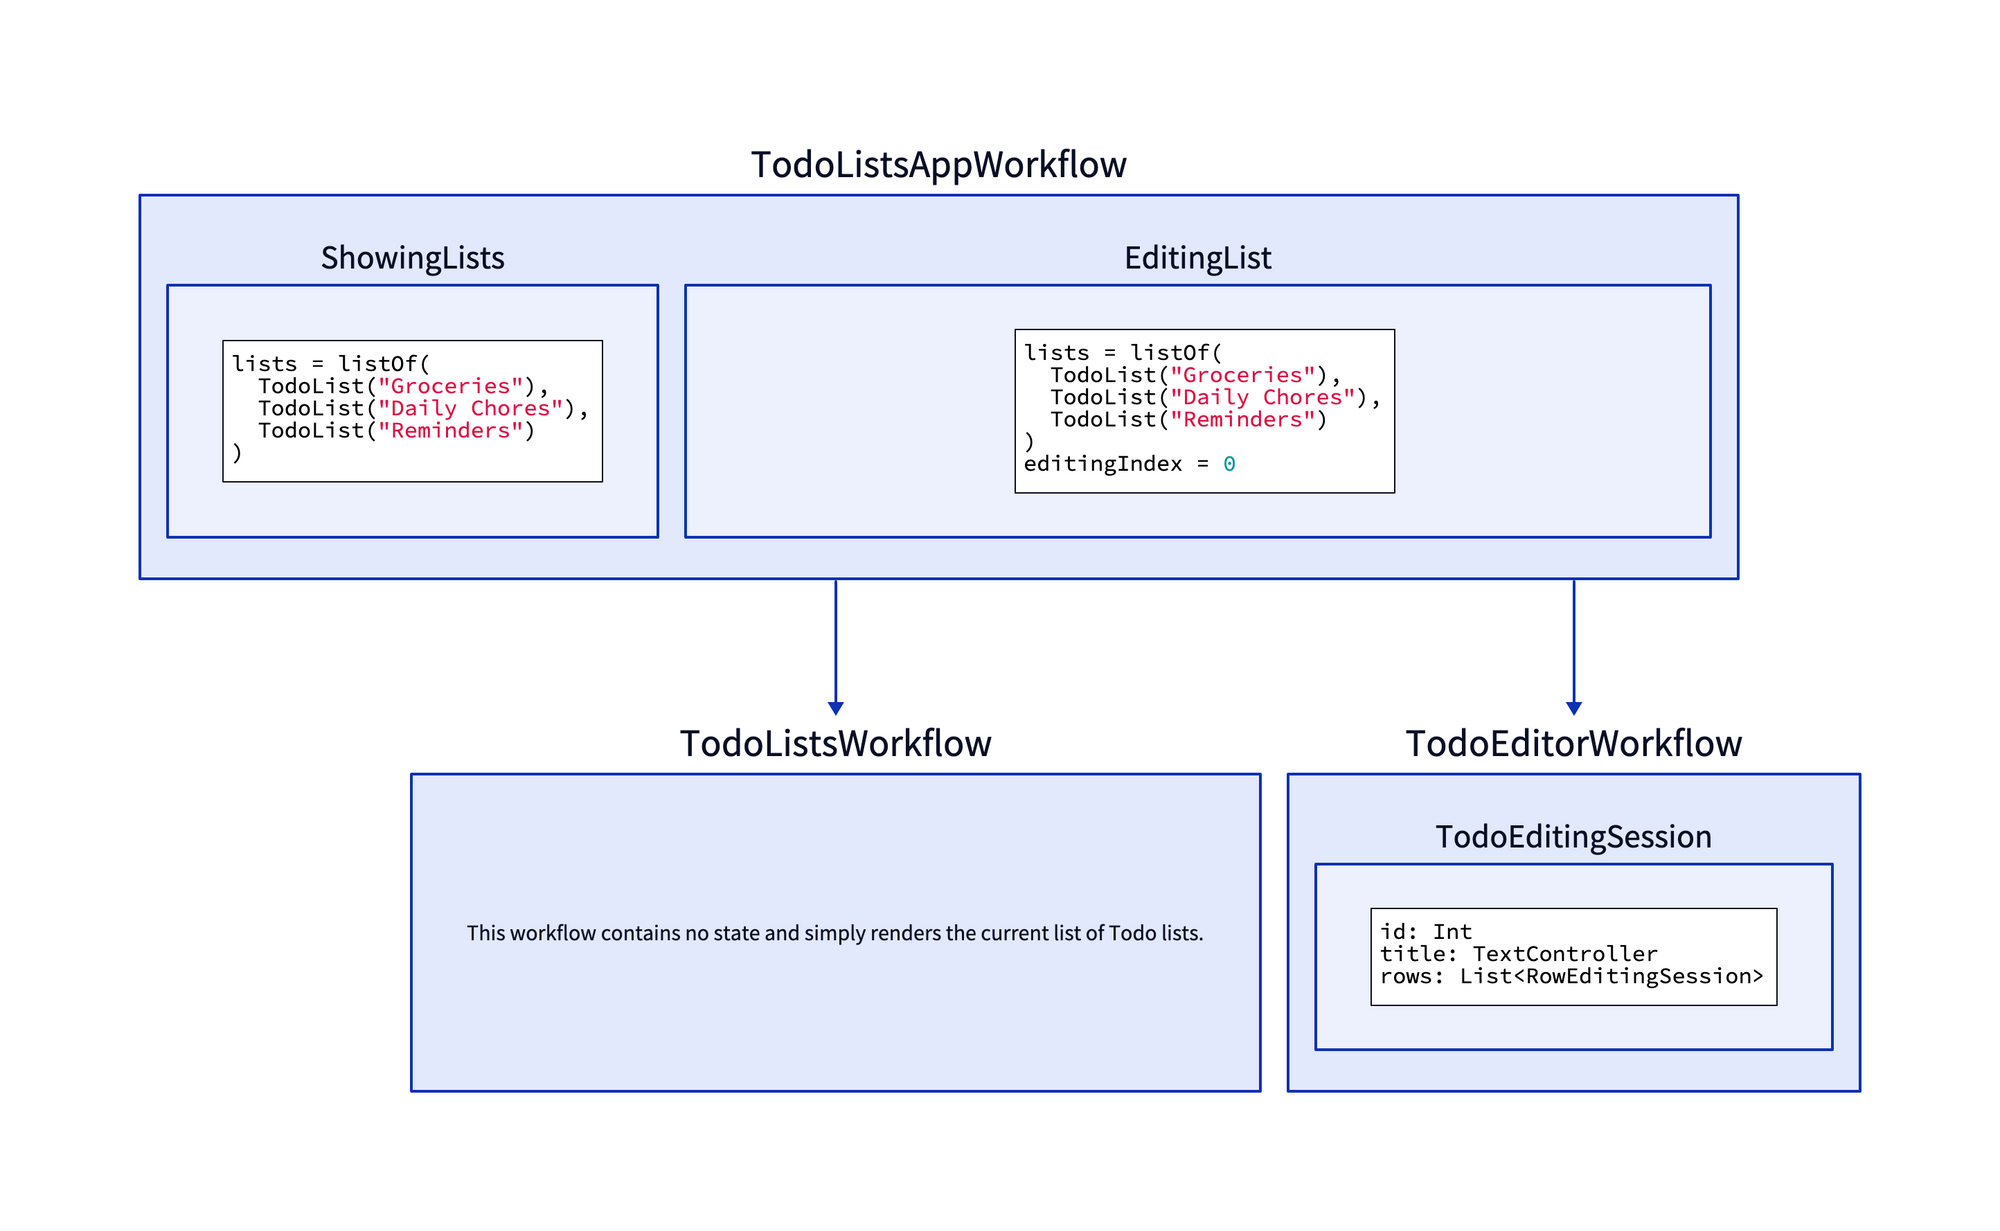
This diagram provides slightly more clarity but adding the events and outputs yields a complete system overview.
todo: TodoListsAppWorkflow {
  showing-lists: ShowingLists {
    state: |kotlin
      lists = listOf(
        TodoList("Groceries"),
        TodoList("Daily Chores"),
        TodoList("Reminders")
      )
    |
  }

  editing-list: EditingList {
    state: |kotlin
      lists = listOf(
        TodoList("Groceries"),
        TodoList("Daily Chores"),
        TodoList("Reminders")
      )
      editingIndex: Int
    |
  }
}

todo-lists: TodoListsWorkflow {
  explanation: |md
    This workflow contains no state and simply renders the current list of Todo lists.
  |
}
todo-editor: TodoEditorWorkflow {
  session: TodoEditingSession {
    state: |kotlin
      id: Int
      title: TextController
      rows: List<RowEditingSession>
    |
  }
}

todo.showing-lists -> todo-lists: Show lists
todo.editing-list -> todo-editor: Edit list
todo-lists -> todo.editing-list: List selected
todo-editor -> todo.editing-list: List updated
todo-editor -> todo.showing-lists: Done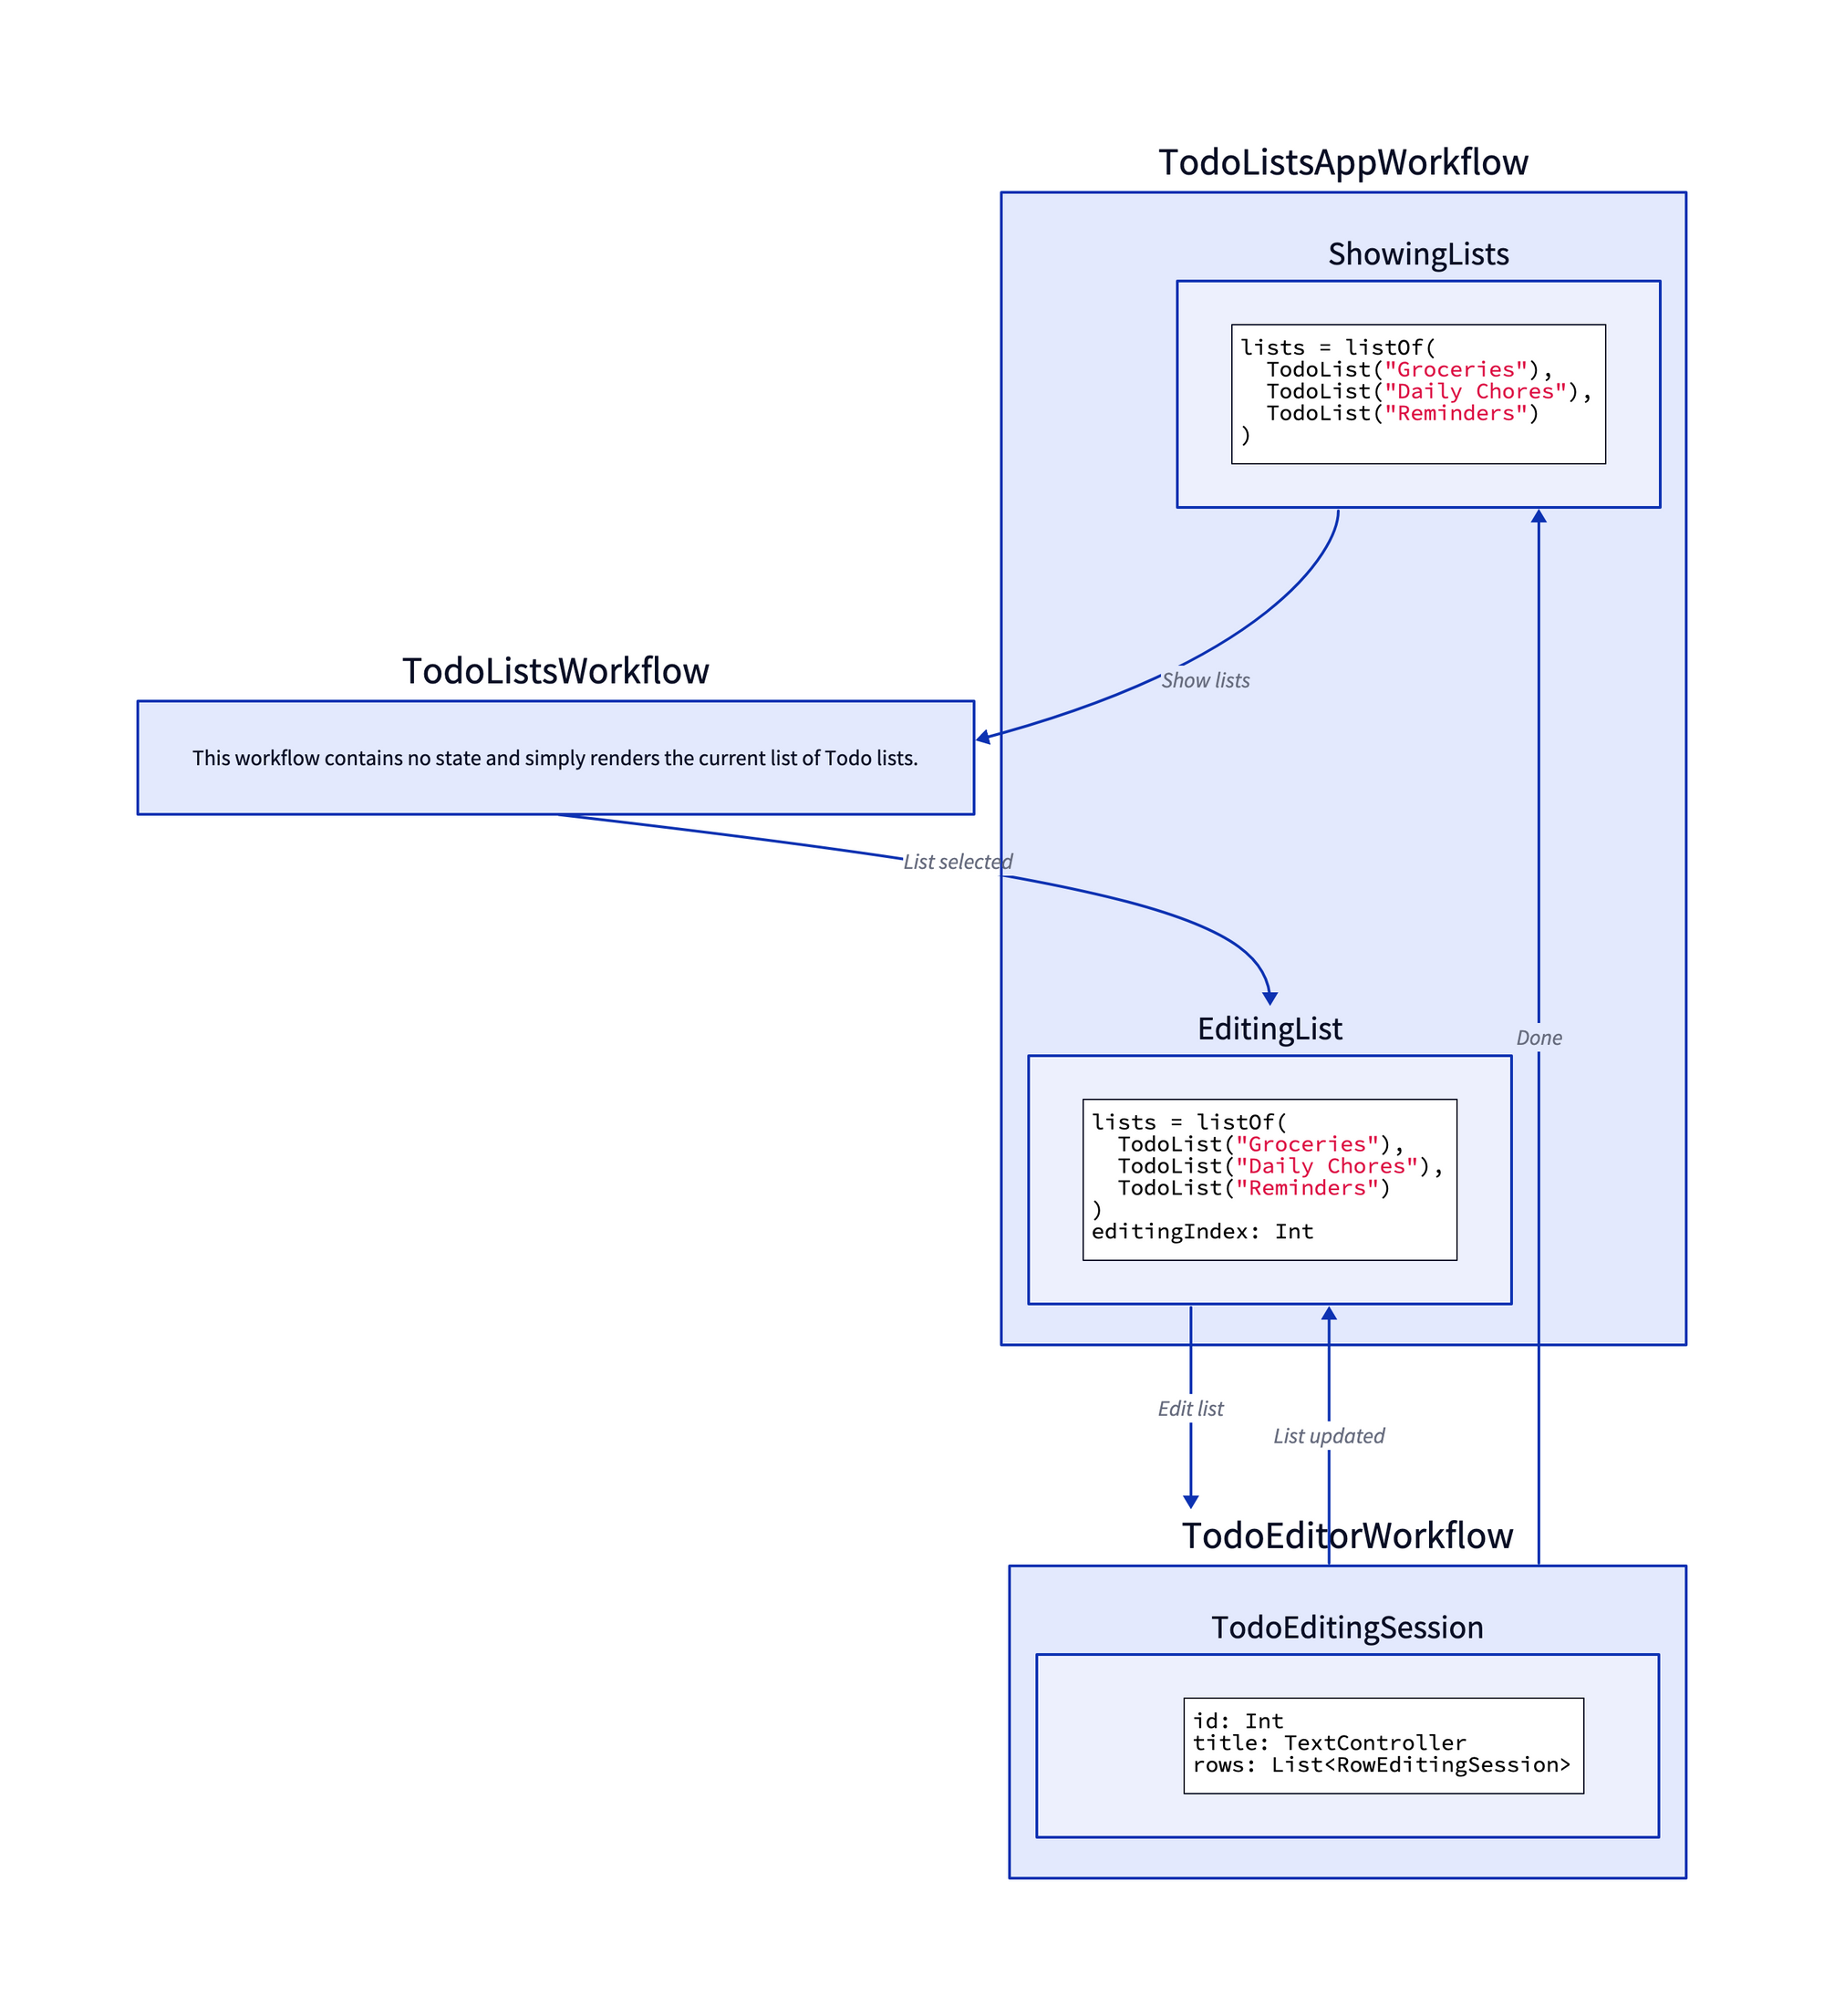
And voila, the diagram shows the three workflows, each of their respective states, and the events and transitions that explain the state changes. While not an exact representation of how the application runs, the diagram at least now shows the relationship between each of the Workflows, and as a viewer, I can build some basic understanding of the app. The point here is not so much to diagram exactly how the app works—it is not a blueprint—but to establish an accurate enough canvas by which to build your own or team's understanding of a state machine driven app.
D2 works well for folks who may feel intimidated by the infinite white canvas or frustrated by the drag-and-drop experience provided by many diagramming solutions and can provide a pleasant middle ground between prototyping with code and diagramming for, say a complex change you would like to propose. That's not to say that D2 is without drawbacks; I find that as the diagram complexity increases, the visualization renders less readable, and the output may not reflect the aesthetic I would apply when crafting a diagram by hand. However, this is probably a feature and not a bug for some to avoid thirty minutes perfecting line-and-arrow placements. Instead, prototype and diagram what you see as text and give D2 a spin handling the visualizations.